Unveiling the Secrets of Foodie-Fi's Subscription Business
A Journey into Data-Driven Insights and Success in the World of Food Entertainment

Introduction:
Subscription based businesses are super popular and Danny realised that there was a large gap in the market - he wanted to create a new streaming service that only had food related content - something like Netflix but with only cooking shows!
Danny finds a few smart friends to launch his new startup Foodie-Fi in 2020 and started selling monthly and annual subscriptions, giving their customers unlimited on-demand access to exclusive food videos from around the world!
Danny created Foodie-Fi with a data driven mindset and wanted to ensure all future investment decisions and new features were decided using data. This case study focuses on using subscription style digital data to answer important business questions.
Available Data
Danny has shared the data design for Foodie-Fi and also short descriptions on each of the database tables - our case study focuses on only 2 tables but there will be a challenge to create a new table for the Foodie-Fi team.
Danny has shared with me 2 key datasets for this case study:
planssubscriptions
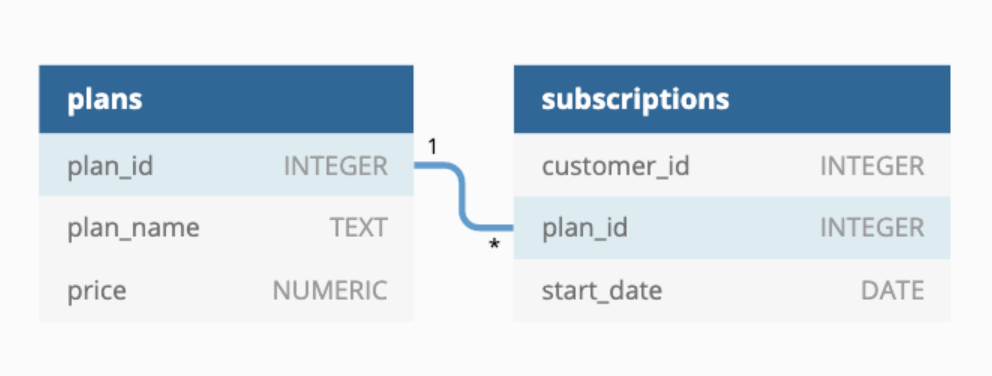
Entity Relationship Diagram
Example Datasets
All datasets exist within the Foodie-Fi database schema
Table 1 : plans
Customers can choose which plans to join Foodie-Fi when they first sign up.
Basic plan customers have limited access and can only stream their videos and is only available monthly at $9.90
Pro plan customers have no watch time limits and are able to download videos for offline viewing. Pro plans start at $19.90 a month or $199 for an annual subscription.
Customers can sign up to an initial 7 day free trial will automatically continue with the pro monthly subscription plan unless they cancel, downgrade to basic or upgrade to an annual pro plan at any point during the trial.
When customers cancel their Foodie-Fi service - they will have a churn plan record with a null price but their plan will continue until the end of the billing period.
| plan_id | plan_name | price |
|---|---|---|
| 0 | trial | 0 |
| 1 | basic monthly | 9.90 |
| 2 | pro monthly | 19.90 |
| 3 | pro annual | 199 |
| 4 | churn | null |
Table 2 : subscriptions
Customer subscriptions show the exact date where their specific plan_id starts.
If customers downgrade from a pro plan or cancel their subscription - the higher plan will remain in place until the period is over - the start_date in the subscriptions table will reflect the date that the actual plan changes.
When customers upgrade their account from a basic plan to a pro or annual pro plan - the higher plan will take effect straightaway.
When customers churn - they will keep their access until the end of their current billing period but the start_date will be technically the day they decided to cancel their service.
| customer_id | plan_id | start_date |
|---|---|---|
| 1 | 0 | 2020-08-01 |
| 1 | 1 | 2020-08-08 |
| 2 | 0 | 2020-09-20 |
| 2 | 3 | 2020-09-27 |
| 11 | 0 | 2020-11-19 |
| 11 | 4 | 2020-11-26 |
Credits - Grateful to Danny Ma for Creating this case study
LinkedIn: Danny Ma on LinkedIn
Case Study Questions
A. Customer Journey
1. Based off the 8 sample customers provided below from the subscriptions table, write a brief description about each customer’s onboarding journey.
This is the sample data:
| customer_id | plan_id | start_date |
|---|---|---|
| 1 | 0 | 2020-08-01 |
| 1 | 1 | 2020-08-08 |
| 2 | 0 | 2020-09-20 |
| 2 | 3 | 2020-09-27 |
| 11 | 0 | 2020-11-19 |
| 11 | 4 | 2020-11-26 |
| 13 | 0 | 2020-12-15 |
| 13 | 1 | 2020-12-22 |
| 13 | 2 | 2021-03-29 |
| 15 | 0 | 2020-03-17 |
| 15 | 2 | 2020-03-24 |
| 15 | 4 | 2020-04-29 |
| 16 | 0 | 2020-05-31 |
| 16 | 1 | 2020-06-07 |
| 16 | 3 | 2020-10-21 |
| 18 | 0 | 2020-07-06 |
| 18 | 2 | 2020-07-13 |
| 19 | 0 | 2020-06-22 |
| 19 | 2 | 2020-06-29 |
| 19 | 3 | 2020-08-29 |
Onboarding Journey
Customer 1:
- Started with a trial plan on 2020-08-01.
- Upgraded to the basic monthly plan on 2020-08-08.
Customer 2:
- Started with a trial plan on 2020-09-20.
- Upgraded to the pro annual plan on 2020-09-27.
Customer 11:
- Started with a trial plan on 2020-11-19.
- Churned (canceled their subscription) on 2020-11-26.
Customer 13:
- Started with a trial plan on 2020-12-15.
- Upgraded to the basic monthly plan on 2020-12-22.
- Upgraded to the pro monthly plan on 2021-03-29.
Customer 15:
- Started with a trial plan on 2020-03-17.
- Upgraded to the pro monthly plan on 2020-03-24.
- Churned (canceled their subscription) on 2020-04-29.
Customer 16:
- Started with a trial plan on 2020-05-31.
- Upgraded to the basic monthly plan on 2020-06-07.
- Upgraded to the pro annual plan on 2020-10-21.
Customer 18:
- Started with a trial plan on 2020-07-06.
- Upgraded to the pro monthly plan on 2020-07-13.
Customer 19:
- Started with a trial plan on 2020-06-22.
- Upgraded to the pro monthly plan on 2020-06-29.
- Upgraded to the pro annual plan on 2020-08-29.
B. Data Analysis Questions
1. How many customers has Foodie-Fi ever had?
Foodie-Fi has 1,000 unique customers.
Detailed Explanation
Click to view
Customer Retention:
By knowing the exact number of unique customers, Foodie-Fi can track and analyze their customer retention rate. This metric helps the business understand how many customers they retain over a given period. By monitoring and improving customer retention, Foodie-Fi can focus on strategies to keep existing customers engaged and satisfied, ultimately reducing customer churn.Revenue Projection:
The number of unique customers is a crucial factor in revenue projection. Foodie-Fi can use this information to estimate their potential revenue by considering factors such as average revenue per customer, subscription plans, and pricing models. It helps in setting realistic financial goals and evaluating the effectiveness of marketing and sales efforts.Customer Segmentation:
Analyzing customer data, such as demographics, preferences, and behaviors, becomes more effective when there is an accurate count of unique customers. Foodie-Fi can segment their customer base into different groups based on various criteria. This segmentation allows them to tailor their marketing strategies, personalized offers, and content to specific customer segments, improving customer satisfaction and engagement.Customer Lifetime Value (CLV) Analysis:
CLV is a crucial metric for understanding the long-term profitability of a customer. By knowing the number of unique customers, Foodie-Fi can calculate the average CLV, which helps them determine how much they can invest in acquiring new customers and retaining existing ones. CLV analysis assists in making informed decisions regarding customer acquisition costs, retention strategies, and maximizing overall profitability.Marketing and Growth Strategies:
The count of unique customers serves as a baseline for evaluating the effectiveness of marketing campaigns and growth strategies. Foodie-Fi can track the growth rate of their customer base over time and compare it against their targets. This data helps identify successful marketing channels, optimize customer acquisition efforts, and identify potential areas for improvement.Short Explanation (Summary)
Click to view
Knowing that Foodie-Fi has 1,000 unique customers helps the business in customer retention, revenue projection, customer segmentation, customer lifetime value analysis, and marketing/growth strategies.
2. What is the monthly distribution of trial plan start_date values for our dataset - use the start of the month as the group by value
March has the highest number of trial plans among all the months, while February has the lowest count.
Detailed Explanation
Click to view
Performance evaluation:
The count of trial plans allows the business to evaluate the success and effectiveness of its trial program over different months. It provides insights into the popularity and conversion rates of trial plans, indicating how well the business is attracting and retaining customers.Demand forecasting:
By analyzing the count of trial plans for each month, the business can forecast future demand for its products or services. It helps in understanding seasonal trends or patterns in customer acquisition and planning resources accordingly.Marketing and promotions:
Understanding the count of trial plans per month helps the business in planning targeted marketing and promotional campaigns. By identifying months with higher or lower trial plan uptake, the business can tailor its marketing efforts to maximize conversions during peak periods or boost engagement during slower months.Revenue planning:
The count of trial plans assists in revenue planning and forecasting. It provides a baseline for estimating potential conversions and subsequent revenue from trial customers. This information supports financial planning and budgeting activities.Program optimization:
Monitoring the count of trial plans helps the business identify areas for program optimization. By analyzing variations in trial plan uptake across different months, the business can identify factors that contribute to higher or lower conversion rates. It enables adjustments to trial plan offerings, pricing, or marketing strategies to optimize conversions and maximize customer retention.Short Explanation (Summary)
Click to view
Knowing the count of trial plans for each month supports performance evaluation, demand forecasting, marketing and promotions, revenue planning, and program optimization. It enables the business to make data-driven decisions, improve customer acquisition and retention, and drive revenue growth.
3. What plan start_date values occur after the year 2020 for our dataset? Show the breakdown by count of events for each plan_name
There are 8 subscribers to the "Basic Monthly" plan, 60 subscribers to the "Pro Monthly" plan, 63 subscribers to the "Pro Annual" plan, and 71 subscribers who have churned.
Detailed Explanation
Click to view
Plan performance evaluation:
The count of subscribers allows the business to evaluate the popularity and performance of each plan. It provides insights into customer preferences and helps identify which plans are attracting more customers.Revenue analysis:
By knowing the count of subscribers for each plan, the business can analyze the revenue generated from each plan. It helps in assessing the profitability and contribution of different plans to the overall revenue of the business.Customer segmentation:
Understanding the count of subscribers for each plan helps in customer segmentation. It enables the business to identify specific customer groups based on their plan preferences. This information can be used to tailor marketing strategies, personalize offers, and provide targeted customer support.Churn analysis:
The count of subscribers who have churned provides insights into customer attrition. By monitoring churn rates for different plans, the business can identify potential issues or dissatisfaction factors specific to certain plans. This helps in implementing retention strategies and improving customer satisfaction.Pricing and plan optimization:
Analyzing the count of subscribers for each plan helps in pricing and plan optimization. It assists in determining the attractiveness of different pricing tiers and identifying opportunities for plan improvements or adjustments. This information supports data-driven decisions regarding pricing strategies and plan enhancements.Short Explanation (Summary)
Click to view
Knowing the count of subscribers for each plan enables plan performance evaluation, revenue analysis, customer segmentation, churn analysis, and pricing and plan optimization. It helps the business make informed decisions to maximize customer acquisition, retention, and revenue growth.
4. What is the customer count and percentage of customers who have churned rounded to 1 decimal place?
Out of the total customer base of Foodie-Fi, 307 customers have churned. This represents approximately 30.7% of the overall customer count.
Detailed Explanation
Click to view
Customer retention analysis:
Understanding the churn count and percentage provides insights into customer retention rates. It allows the business to assess its ability to retain customers and identify factors that contribute to churn.Performance evaluation:
Monitoring the churn count and percentage helps evaluate the effectiveness of customer retention strategies and the overall performance of the business. It provides a benchmark for tracking improvements in customer retention efforts over time.Customer satisfaction analysis:
Analyzing churn helps the business identify potential issues or areas of dissatisfaction among customers. It enables the business to take corrective actions, improve customer satisfaction, and reduce churn rates.Revenue impact assessment:
Churn analysis allows the business to assess the financial impact of customer attrition. By understanding the count and percentage of churned customers, the business can estimate the revenue loss associated with churn and develop strategies to mitigate it.Retention strategy development:
Knowing the churn count and percentage helps the business develop targeted retention strategies. It provides insights into customer behavior and preferences, allowing the business to tailor offers, improve communication, and implement customer-centric initiatives to reduce churn.Short Explanation (Summary)
Click to view
Knowing the count and percentage of churned customers supports customer retention analysis, performance evaluation, customer satisfaction analysis, revenue impact assessment, and retention strategy development. It enables the business to improve customer retention, increase revenue, and foster long-term customer relationships.